
Should you eat 3 big meals or a lot of smaller meals? The idea of meal frequency has been around for a long time. There have been a panoply of diets espousing the benefits of eating 1 meal a day due to lower insulin levels, greater satiety through fasting, etc. There have also been several diets recommending eating 7+ meals per day. . to stoke your metabolism or some nonsense like that.
Recently, a team of researchers conducted a study in a metabolic ward testing the effects of consuming an isoenergetic diet in 3 meals a day or 14 meals per day
Effects of Meal Frequency on Metabolic Profiles and Substrate Partitioning in Lean Healthy Males
The Subjects
This study had a relatively small sample size (n=12). It was likely small because they were required to spend two, thirty-six hour shifts in a respiration chamber and a ton of invasive procedures.
In order to reduce the variance in the data, the authors had specific inclusion and exclusion criteria. Namely the following:
Exclusion Criteria: BMI >25 kg/m2; metabolic abnormalities and excess alcohol intake (>28 drinks weekly. . . that is a lot of alcohol), and anyone >of 40 years was set to form a homogeneous adult group. Females were also excluded to avoid menstrual cycle effects on energy expenditure. Also, only males of European descent were included for homogeneity reasons.
The Nutrition Intervention.
This study utilized a randomized, 2-way crossover design with at least a 7 day wash out period. Essentially, each subject consumed one of the two diets, did the testing, waited at least 7 days, consumed the other diet, and repeated the testing.
Each subject consumed a Low meal Frequency (LFr) which was eating 3 times a day, or a High meal Frequency (HFr). Both diets were isoenergetic (equal calorie intake) with 15% protein, 30% fat, 55% carbohydrate.
Here is an important distinction, the protein in the diet was dairy protein and vegetable protein.
The LFr ate at 8 AM, Noon, and 5 PM. The HFr group ate every hour from 8 AM until 9 PM.
Each participants caloric intake was determined by their energy expenditure, which was calculated by metabolic rate and physical activity.
Metabolic Rate
As the subjects were in a metabolic chamber, the metabolic rate was captured for each subject.
CGMS
To track the effect of the diets on blood glucose levels throughout the day the participants used continuous glucose monitors. This device samples blood every 10 seconds and reports and average every 5 minutes.
Blood Sampling
Blood was also taken from each participant in the morning before the first meal, 30 minutes after the meal, and every hour until 9:30 PM.
Appetite
Appetite profiles were also measured for each participant using questionnaires
Substrate Metabolism
This part of the paper was a bit complex, but basically, using indirect calorimetry and a radar system, the authors were able to measure substrate metabolism and energy expenditure.
Body Composition
Body composition for each subject was measured in a fasted state using hydrostatic weighing.
The Data
Energy Expenditure and Carb/Fat utilization
Both the LFr and the HFr had the same energy intake and similar energy expenditure. Now interestingly, the LFr group had a higher resting metabolic rate; however, there was no difference in the 24 hour total energy expenditure.
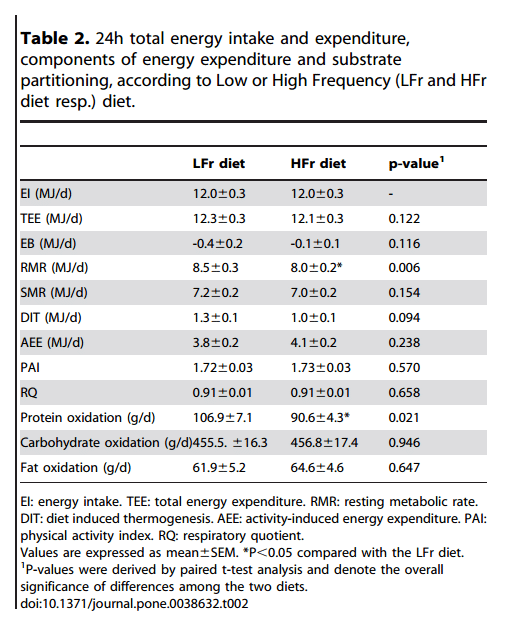
Now while you would think the lower meal frequency would increase fat oxidation due to lower levels of insulin being around, meal frequency had no effect on overall CHO/Fat oxidation. They did find that protein oxidation was a little higher in the LFr group.
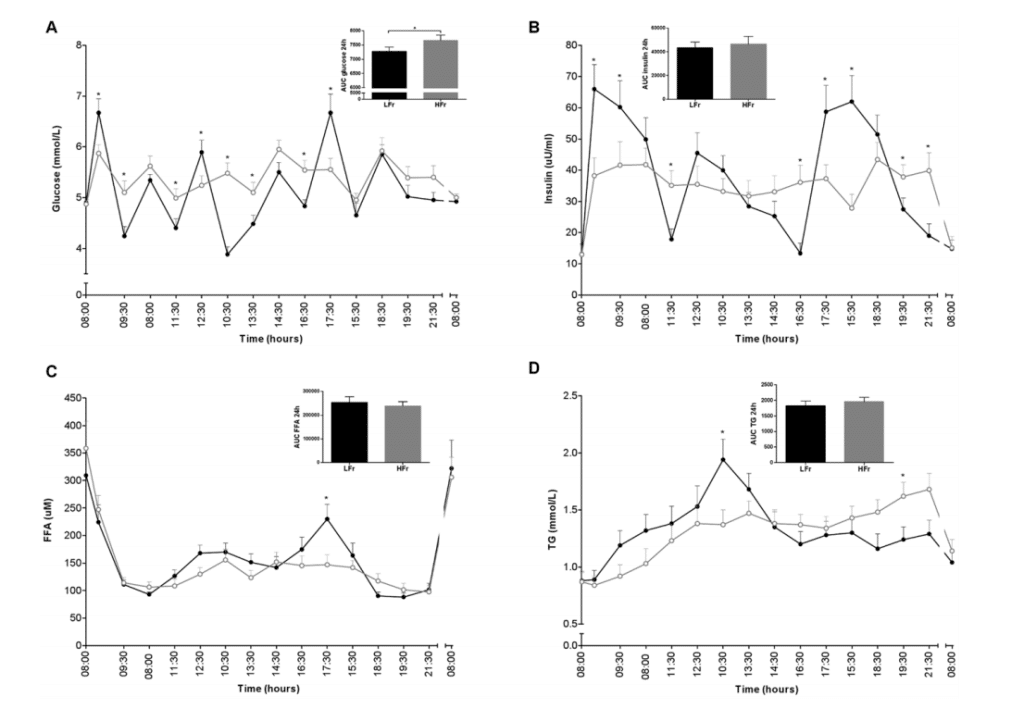
Metabolic Markers
The LFr group showed more variation in glucose and insulin, as to be expected. Total daily glucose levels were lower in the LFr group but there was no difference in insulin.
Free fatty acids were generally higher in the LFr diet compared with the HFr diet. But as previously mentioned, there was no difference between fat oxidation (i.e. utilization for energy) between the two.
GLP-1, a hormone that often increases satiety, was not statistically different between the groups but it did “tend” to be a bit higher in the LFr group (which we will follow up on in a bit).
Ghrelin, a “hunger hormone” was lower throughout the day after breakfast in the LFr group.
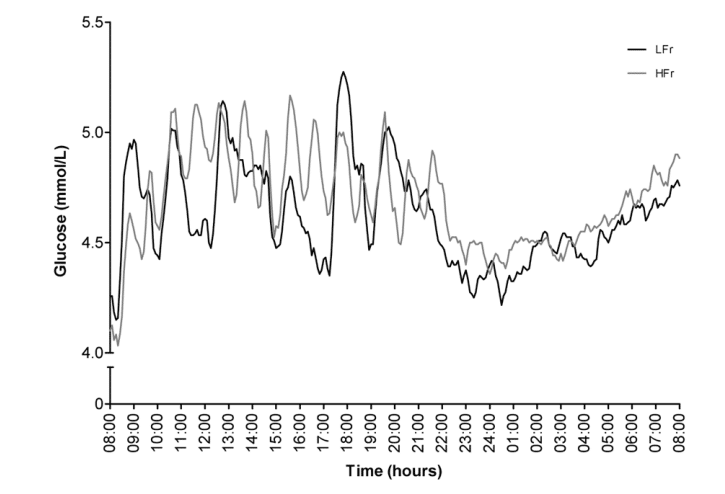
Blood Glucose Fluctuations
While the quantitative measures showed no difference in glucose fluctuations, there were clear differences in glycemic patterns of the two diets.
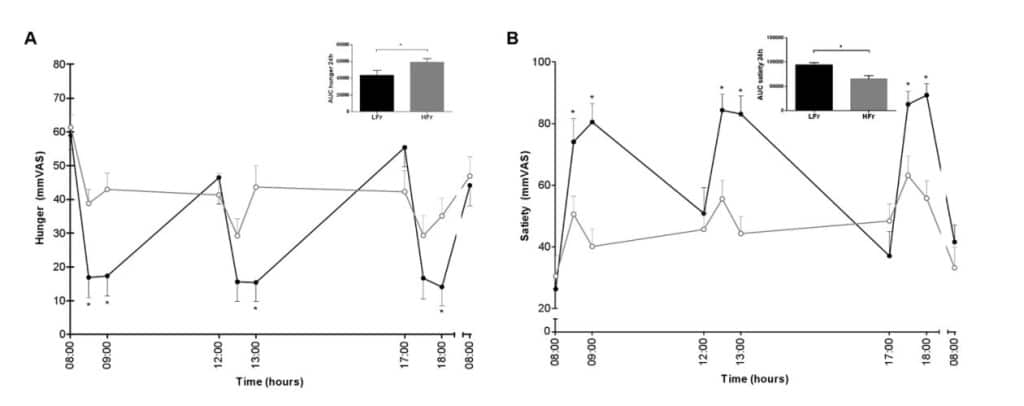
Appetite
Higher frequency eating has been marketed to help “stabilize hunger”… well in this study, lower frequency eating had lower hunger and greater satiety.
The Wrap Up
In a well-controlled study in men in their 20’s, meal frequency had no appreciable effect on daily substrate metabolism. Essentially, regardless of how often you eat, your body will use the same mix of carbs and fat.
If you eat 3 meals a day you will have greater fluctuations in blood glucose, but have a lower overall daily blood glucose when compared to essentially grazing all day.
Also, contrary to popular belief, 3 meals appears to result in better satiety throughout the day.
Now these results need to be interpreted with caution; this study was done in healthy, metabolically flexible men in their mid-twenties. Follow up studies in different populations need to be conducted to extrapolate these results.