To prepare you for this post on the personal differences in carb sensitivity, I want to quote the back-stabbing Cypher from The Matrix, “Buckle your seatbelt Dorothy, because Kansas is going bye-bye”.
Normally I keep posts short and to the point, but this one needs some discussion and a full analysis. This paper is going to highlight some really interesting aspects of nutrition and probably change the way you view yourself, your clients, and diets in general.
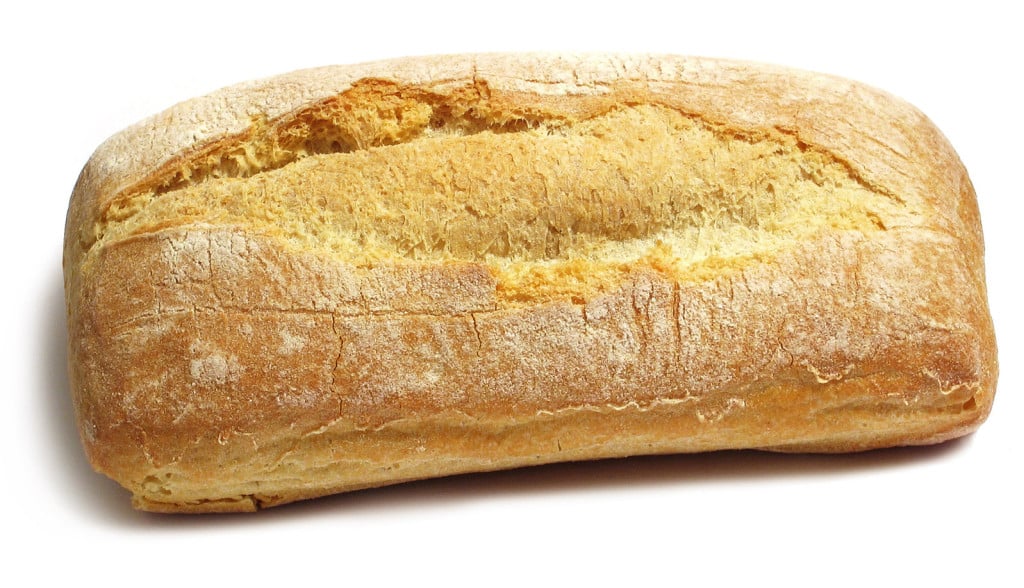
One of the most popular tools in nutrition is the glycemic index. It is a measure of how much glucose appears in the blood after eating a certain food. Things like white bread and sugar have been shown to have some of the highest “glycemic index”.
On the heels of this, one of the big ideas in nutrition and medicine is that the glucose (blood sugar) response to food is an indicator of our health and metabolic status and that minimizing this glucose response by avoiding certain foods is ideal for maintaining health.*
For years we have assumed that when you or I eat a piece of bread or guzzle some sugar laden sweet tea that we both get a big glucose response. Well this hypothesis has recently been refuted, it appears that each person has a very different response to food and carb sensitivity.
The glycemic index as we know it is most likely obsolete
Personalized Nutrition by Prediction of Glycemic Responses
Personalized Carb Sensitivity: The Evidence
The Subjects
This study boasted an enormous sample size (especially considering the tests done on each participant) of 800 people. Now this may not seem that large to many familiar with large medical cohorts but when we dive into the data you will begin to see why.
The participants were a representative population of the non-diabetic Israeli population with 54% overweight and 22% obese (this is slightly leaner than the roughly 67% overweight and 33% obese of the American population).
Glucose Monitoring
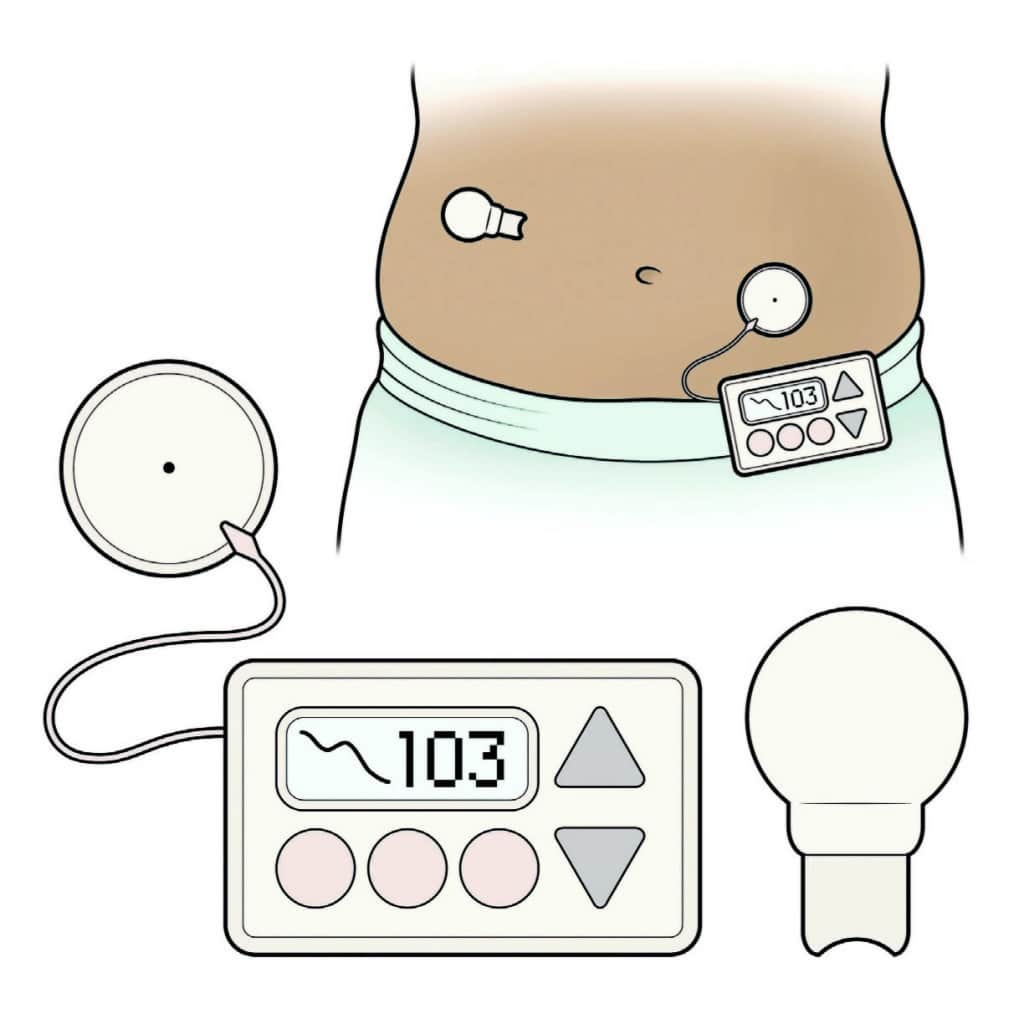
Each of the 800 participants was connected to a continuous glucose monitor. Basically, a device that measures blood glucose every 5 minutes for a week. This resulted in over 1.5 million data points.
Food, Exercise, and Sleep Monitoring
The participants logged their food, exercise, and sleep in real-time, meaning they logged them as they did them. This was so the researchers could match up the blood glucose data with the food data.
Importantly, during the week that the participants were connected to the glucose monitor the participants were given a standard “first meal of the day” so the researchers could more accurately model the glucose response to food.
Another really interesting aspect was that with the logging of food the researchers had data on over 10,000,000 calories which was able to show the highly varying nature of peoples food intake choices (in terms of macronutrients). The distribution of intakes was really interesting to look at. If we take the peaks as the most common intake (minus the fat at 0-2% intake peak), then most people ate meals that were approximately 20% protein, 40% carbohydrate, and 40% fat.
Your Gut Bugs
They also did a microbiome analysis of each person. Yes, they collected poop and analyzed poop. . . a whole stinking heap of it. When you boil these results down you essentially see that geographic location distinctly separates people in regards to their microbiome
THE RESULTS
Your Glucose Responds to Food makes you a Unique Snowflake
Maybe Tyler Durden was wrong… you actually are a unique snowflake. The researchers took the millions of data points and were able to look at how different people respond to the same food.
First, the authors gave each person the same standardized meal twice and were able to show that the participant’s response to the same food was similar between each meal. Essentially, your blood glucose response is roughly same when you eat a piece of bread today as it is when you eat a piece of bread tomorrow.
Second, they showed that there was a huge amount of variability between people eating the same foods. When I eat a piece of bread my glucose response may be completely opposite of you.
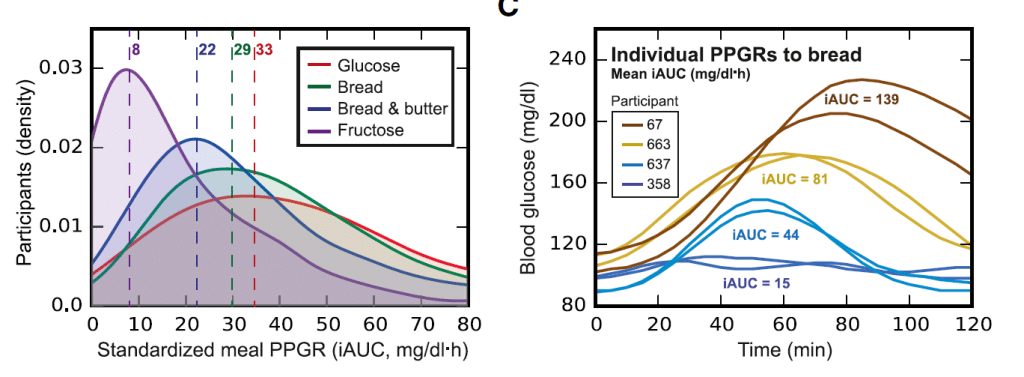
Now an important caveat to this is there was no real difference between people with regard to fructose. Most people saw high levels of blood glucose after consuming fructose. This is puzzling and illuminating, it may perhaps highlight why large fructose boluses (around 50g, the equivalent of a large soda) can be problematic.
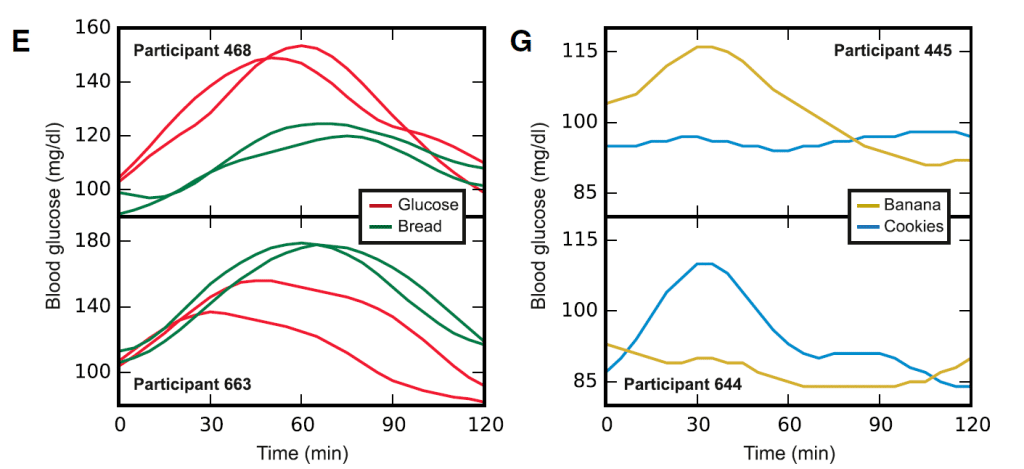
The researchers then analyzed “real-world meals” and found the exact same phenomena. If you and I go out for ice cream, you might get a glucose spike where I might get no glucose spike. This poses some questions to the validity of the glycemic index, which have previously been raised by James Krieger and others.
Your Uniqueness May be a Product of your Gut Bugs
With an initial observation the authors showed a positive correlation between specific gut bacteria (namely Proteobacteria and Enterobacteriaceae) with some of the glucose responses to standardized meals (specifically glucose and bread). This is interesting in that these taxa have been associated with insulin resistance, dyslipidemia, and poor glucose control.
Given some data in mice, where transferring gut microbiota from diabetic mice to normal mice induces insulin resistance and obesity, it is fair to speculate causation here, with gut bacteria profiles being causal in glucose responses to food (1,2,3).
Another interesting aspect of this paper was they looked at proteins involved in metabolism and function of bacteria and were able to show associations between the bacterial function and the differing glucose responses to meals.
This further suggests that the type and functionality of your gut bugs impacts your glucose response to food.
Gaze into my crystal ball
Ok, so people differ drastically in their glucose response to food. This information is really only useful if we can use to predict peoples response and then tailor their diet accordingly.*
So the authors did just that. They took the data from the original 800 people, developed a prediction algorithm, and then used an independent group of 100 people to test the algorithm (this is the standard model building set and test set approach used in statistics).
Let’s skip a lot of the mumbo jumbo in this section (it was interesting but doesn’t effect the end result) and get down to the brass tacks. The algorithm generated by the authors was able to get darn close to predicting an individual’s glucose response to food that was almost comparable to the reproducibility of the within person test between the 2 meals.** The test on the 100 new people showed the same level of “accuracy” in terms prediction.
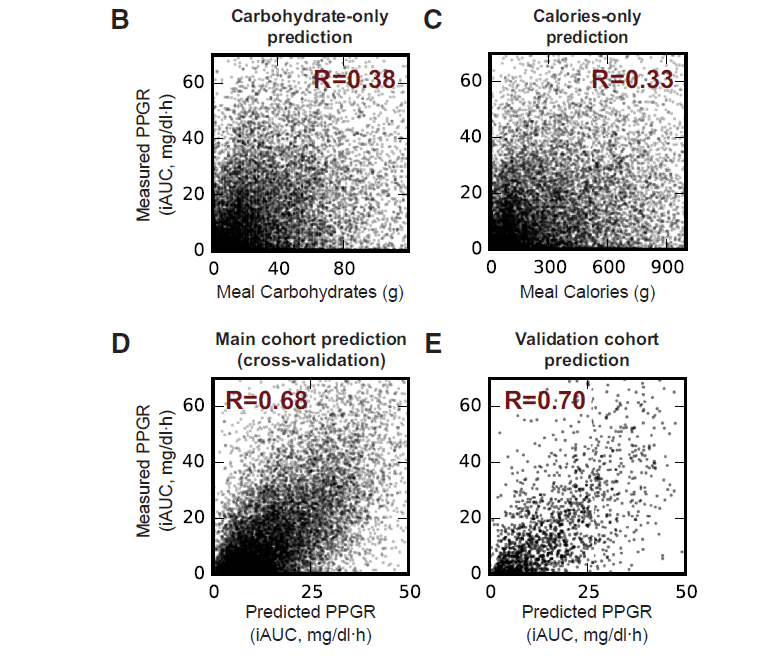
To put the predictive capability of their model into perspective, their model got an R value of 0.68-0.7 whereas using just the carbohydrate content of the meal (essentially our “gold standard” of the glycemic index) they got R=0.38.
What makes you a unique snowflake?
The list of things that can influence your glucose response to food is almost innumerable… yet the authors tried to tack a whack at it in this paper. Again, to spare your bloody details of data analysis, the authors were able to tease out a few main factors.
Carbohydrates are clearly important. In general, the more carbohydrates you eat, the higher the glucose response. Yet upon further analysis they showed there are essentially two categories of people: “carb sensitive” and “carb insensitive”. Mike T Nelson has been on this for years and has used it to really good effect. Bottom line, your glucose response to carbohydrate is highly personal.
Oddly, fat content showed the same thing. Some people had lower glucose responses as fat content increased but some had higher glucose responses as fat increased. So you can also be fat sensitive and fat insensitive.
Other factors such as sodium content, time from last sleep, fiber content, and the type and amount of gut bacteria had effects on how your body responded to a meal.
Overall, the bottom line here is that your glucose response to food is dictated by multiple and diverse factors, including factors unrelated to meal content.
What Can We Do With This?
This paper opens our eyes to a lot of interesting information but is it applicable. I mean science is cool, but if you can’t do anything with it what is the point?
The author’s then asked whether they could use their prediction algorithm to construct diets that minimize the glucose response to food for people.*
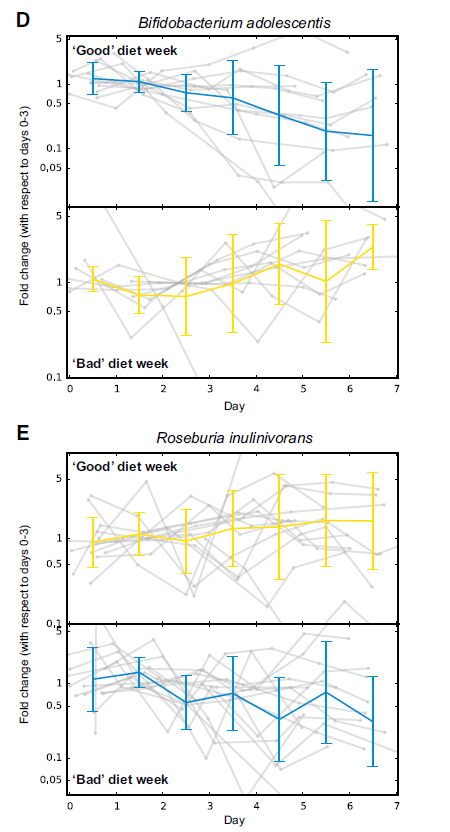
Essentially, they took 26 participants and connected them to the glucose monitors, ran the same profiling as the big cohort and gave them an individualized diet base on their data. The diets were determined “good” and “bad” with the good diet being predicted to have low glucose response and the bad being predicted to have high glucose response.
The compared this to a control group where they had an “expert” look at their glucose monitoring data and prescribe them a diet they thought (not using the prediction algorithm) would minimize glucose response.
How did this work?
Overall it was largely successful. 10 of the 12 participants in the prediction based diet showed better glucose control in the “good” diet than the “bad diet”. This was similar to the “Expert” group with 8 of 14 people showing better glucose control in the “good” diet than the “bad” diet.
In addition to improved glucose response, the participants saw “improvements” in their gut bugs (gut microbiome) on the “good” diet. These changes were consistent with what would be expected with a lower glucose response to food.
Essentially, the prediction algorithm based on all the data did as good, if not slightly better, than an expert at programming nutritional regimens.
The Wrap Up
Our notion of the glycemic index is outdated. Each person has a highly individualized glucose response to carbohydrate and fat intake.
Blanket statements and dogmatic views about nutrition are likely to be inadequate to improve a person’s weight and health.
Much like “personalized medicine”, personalized nutrition ought to be a focus in the future as we continue to reduce the burden of diseases driven by obesity.
*Here I am making the assumption that for the general population trying to reduce risk of disease that minimizing glucose excursions is beneficial… if you take umbrage with this email me and we can chat about this in-depth
** The predictive model: (R = 0.68, p < 1010, Figure 3D). This correlation approaches the presumed upper bound limit set by the 0.71–0.77 correlation that we observed between the PPGR of the sameperson to two replicates of the same standardized meal.Italics are author’s original language, not mine