
Tl;dr: Calorie restriction for two years induces weight loss and lowers metabolic rate and lowers measures of oxidative stress. This doesn’t provide evidence that calorie restriction makes you live longer or age slower.
Ok, so it has been a hot minute since we wrote an article on one study. I have been a lot more focused on developing larger ideas and concepts but a recent paper was published that needs some direct attention.
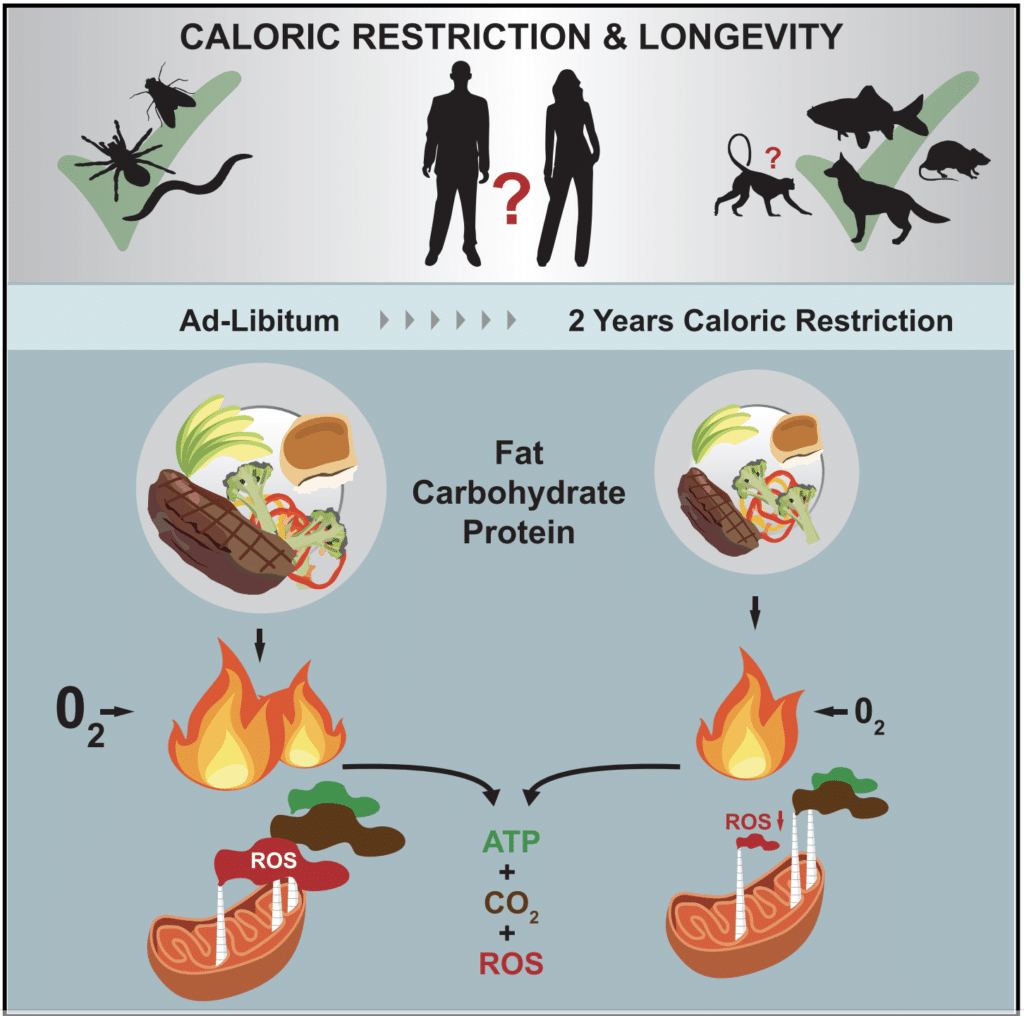
For several decades there have been hypotheses suggesting that fasting increases longevity and slows aging. Much of the research has been focused in model organisms, such as nematodes, rodents, and monkeys. A recent paper was published that “attempted” to look at the effect of caloric restriction on aging in human.
Why don’t we dive into the paper and then discuss the results and contextualize them.
The Study Design
54 people were randomized to either a regular, “isocaloric” diet or a 25% calorie reduced diet and followed for two years.
Here is the most relevant text from the article that helps summarize the intervention (paragraph broken up for readability):
“From day 1, the caloric restriction (CR) intervention targeted a sustained 25% restriction of energy intake prescribed on the basis of the energy requirements determined from two, 14-day doubly labeled water measures at baseline.
The goal for the intervention was adherence to a mathematically predicted weight loss trajectory that reached 15.5% below baseline weight after one year of intervention followed by maintenance of this weight over the second year (Pieper et al., 2011). Participants received a weekly weight loss graph that showed a targeted weight range which was used as the primary tool to maintain adherence during the intervention.
Because of the variability in projected weight loss needed to achieve 25% CR, participants were also provided with guidance indicating a ‘‘zone of acceptable weight loss’’ which ranged from 12 to 22%. Nutritional and behavioral guidance was customized and modified to decrease the degree to which weight change differed from the target.
Adherence to 25% CR was further fostered by provision of meals for the first 27 days of the study. Participants were fed their assigned caloric prescription in the form of three, 9 day diets. The food provision was used to educate on portion size, energy content and anticipated diet changes necessary to maintain 25% CR with different types of dietary patterns.
The behavioral intervention included delivery of a structured curriculum in regular group and individual meetings with interventionists (clinical psychologists and nutritionists) from a standardized treatment manual developed specifically for the study (Rickman et al., 2011).
Participants randomized to the control group were advised to continue their current diets on a completely ad libitum basis. No specific level of physical activity was required or recommended for either group.
All participants received a multivitamin (Nature Made Multi Complete, Pharmavite LLC, Mission Hills, CA) and calcium supplement (1000mg/d, Douglas laboratories, Pittsburgh, PA) to foster nutritional adequacy of the self selected diets”.
Participants were measured for body composition, energy expenditure, thyroid hormones, leptin, adiponectin, and lipid peroxidation in their urine at baseline and at the end of year 1 and year 2. For more details on some of the measurements they used and detailed description of the data collection please see here.
Results
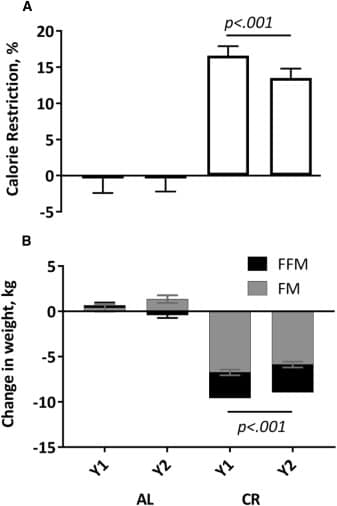
The caloric restriction group fell a bit short of their 25% restriction goal but did reduce calories ~15% over the course of the study. This represents a roughly 300 kcal reduction based on a 2,000 kcal a day diet. The control group did not see any real changes (+/-2%) in energy intake over the two years of the study.
Now before we move into the actual results of the intervention there is one important piece to discuss. The data reported in the paper is not the actual data with means and standard deviations. The data reported are least squares means and standard error, not observed means and standard deviations
The caloric restriction group lost ~9 kg over the two years with almost all the weight loss coming during year one and then maintaining at year two. Much of this weight loss was fat loss (~70%). The control group did not lose any meaningful weight (Figure 1). This is an important finding as it has implications for the rest of the results and the interpretation of these data.
The author’s also measured 24 hour energy expenditure (this was measured in a sedentary setting) and energy expenditure during sleep using doubly labeled water and a metabolic chamber. 24 hour energy expenditure was decreased in both groups, yet sleeping energy expenditure was only decreased in the caloric restriction group. As changes in body mass (i.e. weight loss) are known to reduce energy expenditure, the authors also attempted to take this into account and found that after adjusting for body mass losses, there was still a 7% decrease in sleeping energy expenditure.
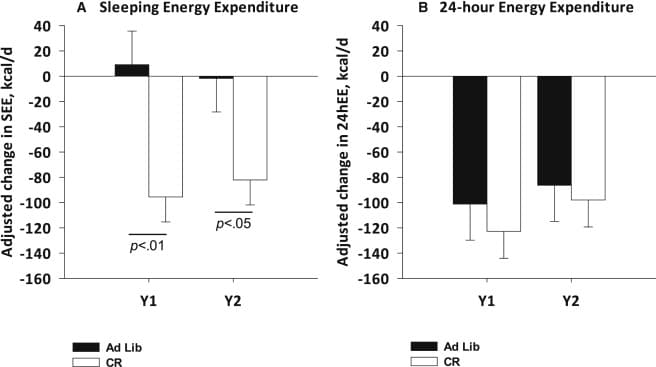
Furthermore, by year 2 there was a roughly 120 kcal decrease per day in activity related energy expenditure and a roughly 30 kcal decrease per day in spontaneous physical activity.
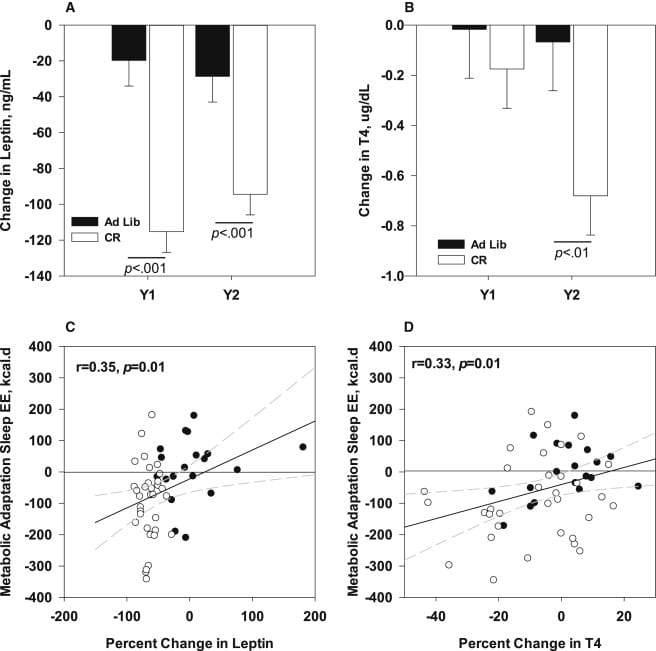
As expected, long periods of caloric restriction reduced triiodothyronine (T3) and thyroxine (T4); however, these decreases did not come with a change in TSH, suggesting that the lower T3 and T4 may represent a new “normal” basal metabolism. Also, at year 2, there was a hint of a signal for lower body temperature at night.
There was an initial decrease in fasting insulin in the calorie restriction group at the end of year 1, a phenomena that disappeared by the end of year 2 with insulin levels returning to normal (I think this might be one of the more striking findings and something that likely puts holes in some of the insulin-longevity hypotheses that exist).
Also as expected leptin levels were modestly reduced by caloric restriction at year one, and then maintained those reduced levels through year 2. Adiponectin levels raised in the caloric restriction group, which is expected given that reductions in fat mass result in higher levels of leptin.
The authors also found correlations between changes in leptin and T4 and changes in sleeping energy expenditure. However, no other correlations were reported so it seems like these may have been some “data exploration”.
The authors also found correlations between changes in leptin and T4 and changes in sleeping energy expenditure. However, no other correlations were reported so it seems like these may have been some “data exploration”.
The author’s also assessed urinary F2-isoprostane excretion, which are measures of lipid peroxidation and surrogate markers for increases levels of oxidative stress. Urine levels of F2-isoprostane were moderately decrease (~25%) at year 1 in the caloric restriction group, which was sustained at year 2, but there was no difference at any time point in the control group.
What can we really learn from this study.
This study is not the first study to conduct a long term weight loss study. However, it is one of the longest CR interventions to date with tight control and solid measurements of body composition,energy expenditure and hormonal change data.
Calorie restriction resulting in weight loss leads to reduced energy expenditure (when not adjusted by deliberately increasing physical activity). This is one of the hallmark features of calorie restriction and weight loss. This is observed in almost all studies with appreciable weight loss. While this does indicate a slowing of overall metabolism, it is difficult to conclude that this reduction in overall metabolism will increase the lifespan or reduce the overall aging of humans to a meaningful degree.
The idea that slower metabolisms increase longevity is based on a body of literature that has grown over the decades but there are fundamental reasons to think this is far too simplistic. In a recent review paper Dr. Speakman stated (again, the spaces in paragraphs are my own for readability),
“… across species a gram of tissue on average expends about the same amount of energy before it dies regardless of whether that tissue is located in a shrew, a cow, an elephant or a whale. This fact led to the notion that ageing and lifespan are processes regulated by energy metabolism rates and that elevating metabolism will be associated with premature mortality–the rate of living theory.
The free-radical theory of ageing provides a potential mechanism that links metabolism to ageing phenomena, since oxygen free radicals are formed as a by-product of oxidative phosphorylation. Despite this potential synergy in these theoretical approaches, the free-radical theory has grown in stature while the rate of living theory has fallen into disrepute.
This is primarily because comparisons made across classes (for example, between birds and mammals) do not conform to the expectations, and even within classes there is substantial interspecific variability in the mass-specific expenditure of energy per lifespan. Using interspecific data to test the rate of living hypothesis is, however, confused by several major problems. For example, appeals that the resultant lifetime expenditure of energy per gram of tissue is ‘too variable’ depend on the biological significance rather than the statistical significance of the variation observed. Moreover, maximum lifespan is not a good marker of ageing and RMR is not a good measure of total energy metabolism.
Analysis of residual lifespan against residual RMR reveals no significant relationship. However, this is still based on RMR. A novel comparison using daily energy expenditure (DEE), rather than BMR, suggests that lifetime expenditure of energy per gram of tissue is NOT independent of body mass, and that tissue in smaller animals expends more energy before expiring than tissue in larger animals. Some of the residual variation in this relationship in mammals is explained by ambient temperature. In addition there is a significant negative relationship between residual lifespan and residual daily energy expenditure in mammals.
A potentially much better model to explore the links of body size, metabolism and ageing is to examine the intraspecific links. These studies have generated some data that support the original rate of living theory and other data that conflict. In particular several studies have shown that manipulating animals to expend more or less energy generate the expected effects on lifespan (particularly when the subjects are ectotherms).
However, smaller individuals with higher rates of metabolism live longer than their slower, larger conspecifics. An addition to these confused observations has been the recent suggestion that under some circumstances we might expect mitochondria to produce fewer free radicals when metabolism is higher–particularly when they are uncoupled. These new ideas concerning the manner in which mitochondria generate free radicals as a function of metabolism shed some light on the complexity of observations linking body size, metabolism and lifespan”.
In few words, there is not a direct, clear relationship that suggests that slower metabolic rate increases longevity and decreases aging. In some cases, higher metabolic rate increases longevity, possibly through uncoupling of mitochondria (this might make sense as releasing heat might have a lower oxidative load than producing free radicals, although the free radical theory of aging and it driving human mortality is still very tenuous in my opinion).
There is not a direct, clear relationship that suggests that slower metabolic rate increases longevity and decreases aging
Furthermore, the data in this paper showing that thyroid function is downregulated also does not really tell us much about aging or longevity. Lower basal thyroid level just mean, once again, that metabolism is slowed. This might indicate that if the person does not maintain substantial caloric restriction long term they may be more likely to accumulate body fat as they age due to lower overall resting metabolic rate and physical activity levels. Furthermore, one must consider the possibility that periods of caloric restriction, especially more aggressive caloric restriction, might lead to future weight gain. In several studies, dieting behaviors in young adults predict future weight gain, in some instances greater weight gain, and poor dietary habits down the road. If we know that increased adiposity is a risk factor for mortality, and caloric restriction decreases overall metabolism in adults, unless that caloric restriction is maintained with age, the initial caloric restriction may not net a benefit over the long term. While there are some very sparse data to suggest this may be related to biological aspects such as depressed metabolism, the more likely answer is it may be largely driven by behavior and overall changes in calorie balance. Regardless of mechanism, these are ideas worth considering and one ought to juxtapose potential benefit of caloric restriction versus the potential end result of it, in a pragmatic sense.
Now for the piece on oxidative stress. The present study measured lipid peroxidation in urine and showed a ~25% decrease in this measure. I have a few thoughts, some of which are contradictory and conflicting. Oxidative stress, when not ‘balanced’ can cause cellular dysfunction and does likely lead to accelerated aging. This avenue of research may help with moving our anti-aging medicine forward. However, the data presented in this paper are not very compelling. We are looking at end-products in urine and not direct levels of oxidative damage in cells, nor are we looking at whether antioxidant machinery in cells are activated by long periods of caloric restriction. In a different study looking at caloric restriction in similar amounts as the present study, there was a barely perceptible change in SIRT3 genes but not in any other measured antioxidant systems. Thus, from the present study it is very premature to suggest that caloric restriction meaningful impacts systemic oxidative stress, or that the degree to which it might will really slow aging.
Let me summarize the findings and their contextual meaning.
- Reducing calories by 25% results in weight loss at 1 year, which is sustained by year 2 but there is no additional weight loss at year 2.
- As observed in numerous previous studies, weight loss as associated with a drop in total energy expenditure and reductions in T3, T4, and leptin, with an increase in adiponectin.
- Urinary measures of lipid peroxidation marginally decreased.
- There is zero data in this study that substantiates the claim of increases in longevity or improved aging via the proposed mechanisms in this paper.